You can use the results displayed in the dashboard to drill
down to more detailed information and perform some recovery actions.
Before you begin
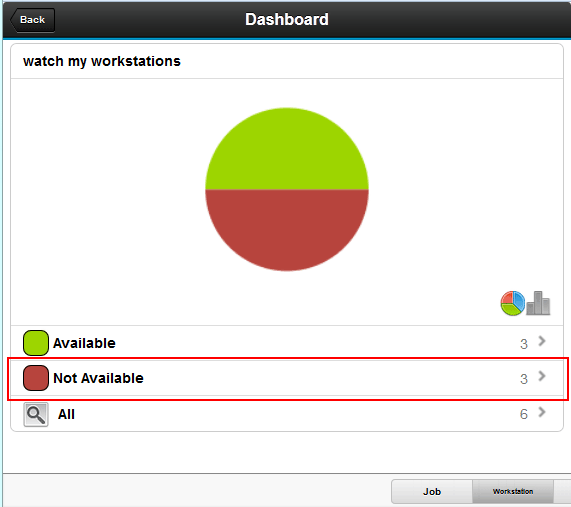
From the dashboard view displaying the results of the query
defined for the dashboard, you can drill down to display more detailed
information. In general, the dashboard results display the number
of available and unavailable workstations for the engines defined
for the dashboard. For these workstations, you can view details about
each individual workstation such as: the workstation name, internal
status, the type of agent workstation, and the link status, to name
a few.
About this task
To view the workstation details for an unavailable workstation:
Procedure
- From the dashboard containing the results of the monitoring
service, scroll down to view the breakdown of workstations by status
and tap the workstations in the Unavailable state.
- A list of workstations in the unavailable state are displayed.
You can search for a specific workstation name by entering a keyword
in the Search field, or scroll to locate a
workstation.
- Tap the workstation for which you want to display further
details.
Results
Details about the workstation are displayed and a set of actions
you can perform on the workstation are available at the end of the
list.
What to do next
You can select to perform an action on the workstation, as
well as send the details about the workstation to a recipient by email.
See
Performing recovery actions on workstations.
