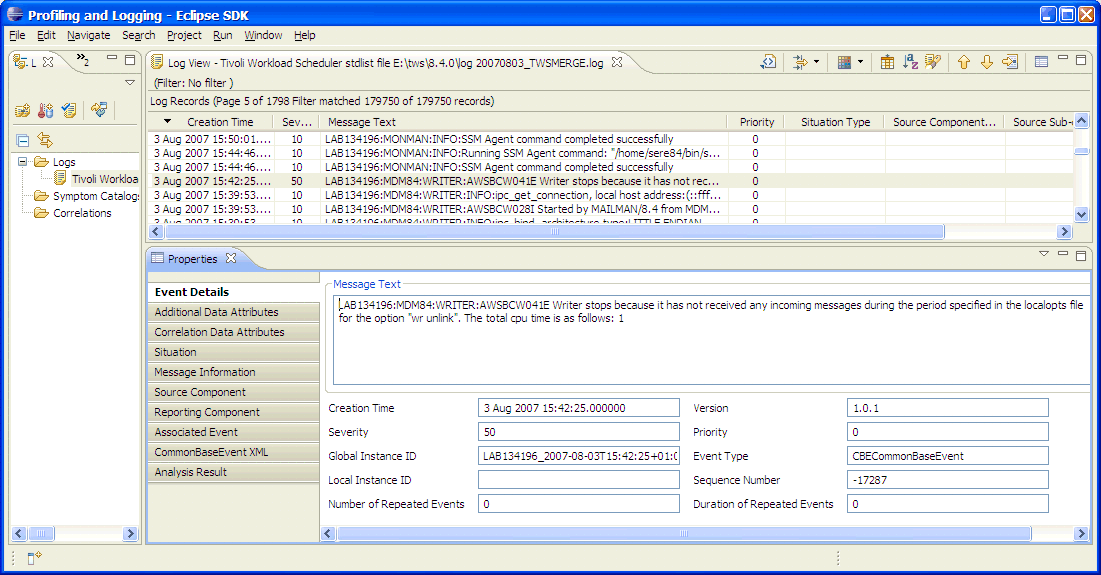
Log Analyzer main window
After you have run Eclipse and the Log Analyzer
window has opened with a log file already added, you see the following
window: 

The window tabs are as follows:
- Log Navigator tab
- This is where your log files are listed. Correlations are created by you (see Comparing log files), and you can work with symptom catalogs (see Analyzing messages with a symptom catalog)
- Log View tab
- The main tab is the Log View tab. This is a list of the records
in the log file. An error message with a severity of 50 has been highlighted
(severities higher than the standard 10 are highlighted in yellow
or red, depending on the severity, but the color disappears when you
click the message to select it.
When a message is highlighted, its details appear in the Properties tab, below. If the Properties tab is not showing, right-click the message you want to examine and select Properties.
Above the Log View tab are the icons that you use to perform the functions of Log Analyzer.
- Properties tab
- This contains several panes of information about the message. Those which contain information with respect to HCL Workload Automation messages are Event Details, Additional Data Attributes, and CommonBaseEvent XML.
For general help for using Eclipse select Help → Help Contents.
For specific help for using Log Analyzer select Help → Dynamic Help