Monitoring the progress of your plan
Request a graphical view of the progress of the current plan.
You can request a graphical view that shows the progress of the current plan on the engines for which you have configured a connection and specified the option to show the engine in the dashboard.
The HCL Workload Automation engine must be version 9.1 or later.
An enhanced graphical view of the plan is also available in the Plan View and Job Stream View, see Graphical views in the plan.
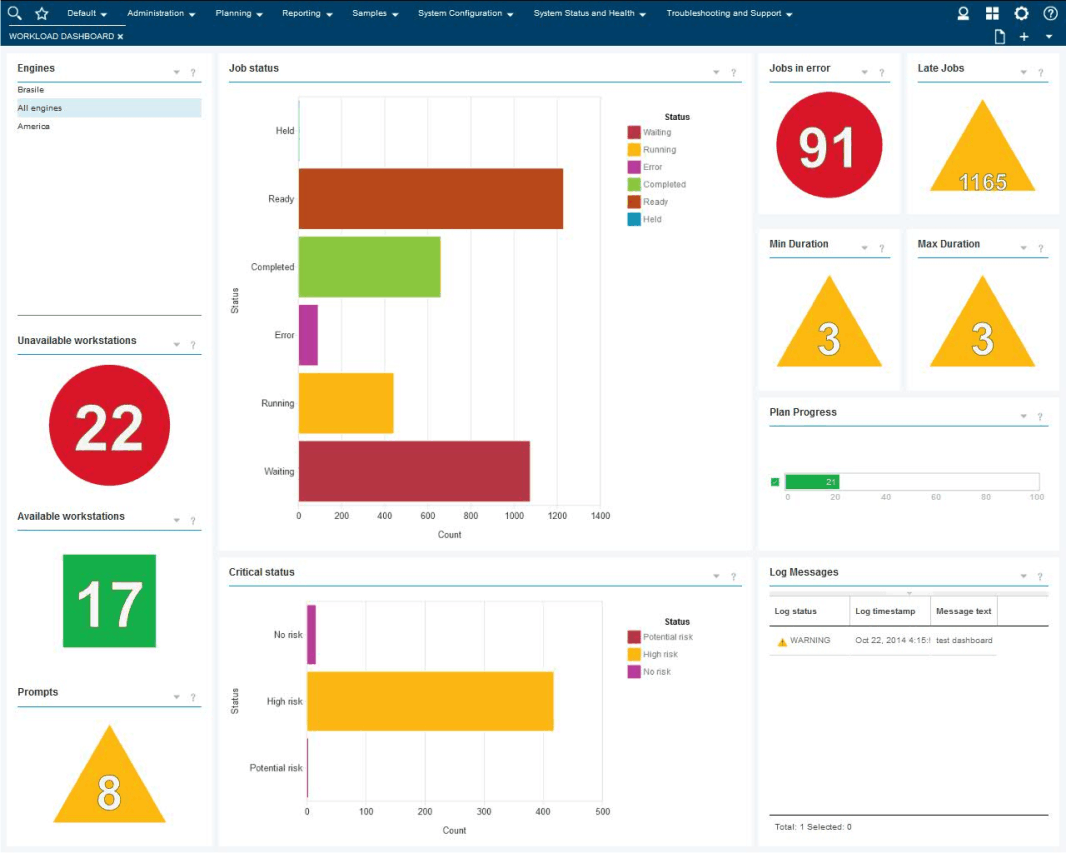
To request this graphical view, in the navigation bar at the top, click System Status and Health > Workload Dashboard. The panel opens showing a number of widgets which return the results for the most widely-used queries. The Workload Dashboard provides a single, consolidated view for monitoring the workload status. You can also drill down through the widgets to the query results to discover more detailed information and fix errors.
To customize the dashboard refresh time interval for all the engines, click System Configuration > Workload Scheduling Settings > Set User Preferences. In the lower part of this panel you can find a section to customize this interval.
Workload Dashboard
In the Workload Dashboard you can view the whole status of your workload at a glance for one or more of the engines you have configured. You can check the status of workstations, jobs, critical jobs, prompts, and other relevant information.

- Job status
- This pane shows the status of the jobs.
- Job in error
- This widget shows how many jobs have completed in error status for the selected engine. By double clicking on the widget the Monitor Jobs view is displayed with detailed information about jobs in error status.
- Late jobs
- This widget shows how many jobs have completed in late status
for the selected engine. By double clicking on the widget the Monitor
Jobs view is displayed with detailed information about
jobs in late status.
This widget is available for distributed engines only.
- Min duration
- This widget shows the number of jobs that have not reached the
minimum duration for the selected engine. By double clicking on the
widget the Monitor Jobs view is displayed with
detailed information about jobs that have not reached the minimum
duration.
This widget is available for distributed engines only.
- Max duration
- This widget shows the number of jobs that have exceeded the maximum
duration for the selected engine. By double clicking on the widget
the Monitor Jobs view is displayed with detailed
information about jobs that have exceeded the maximum duration.
This widget is available for distributed engines only.
- Available workstations
- This widget shows the number of available workstations for the selected engine. By double clicking on the widget the Monitor Jobs view is displayed with detailed information about available workstations.
- Unavailable workstations
- This widget shows the number of unavailable workstations for the selected engine. By double clicking on the widget the Monitor Jobs view is displayed with detailed information about unavailable workstations.
- Prompts
- This panel shows prompts for the selected engine.
This widget is available for distributed engines only.
- Critical status
- This widget shows in tabular format the number of jobs in high, potential, and no risk status for the selected engine. By double clicking on the widget the Monitor Jobs view is displayed with detailed information about jobs in critical status.
- Log messages
- This widget shows in tabular format the status, timestamp and
contents of the message logged for the selected engine.
This widget is available for distributed engines only.