
Graphical views in the plan
You can use these views to monitor the progress of your job streams in the plan from a graphical map.
You can also take several actions on the objects displayed in the view. Almost all of the actions and information available in the traditional views resulting from Monitor queries are also graphically available from these views.
All of the views provide a toolbar that you can use to act upon the views and the objects displayed. For more information about the actions available from the toolbar, see the specific panel help.
You can also export the displayed graphic to either a Scalable Vector Graphics (SVG) file or a Portable Network Graphics (PNG) file . In these formats, vector-based images can be scaled indefinitely without degrading the quality of the image.
| Object | Shape | Icon |
|---|---|---|
| Job |  |
In the Workload Designer, the job is represented by this icon:  . In the plan, this icon is replaced with the icon representing the status of the job, see
Table 2. If the job has a deadline set,
then the deadline is visible in the lower-left corner of the job shape. An icon in the lower-left
corner indicates if a job is time-dependent. . In the plan, this icon is replaced with the icon representing the status of the job, see
Table 2. If the job has a deadline set,
then the deadline is visible in the lower-left corner of the job shape. An icon in the lower-left
corner indicates if a job is time-dependent. |
| Job stream |
|
In the Workload Designer, the job stream is represented by this icon:  . In the plan, the job stream is represented as a container containing jobs. . In the plan, the job stream is represented as a container containing jobs. |
| Prompt | 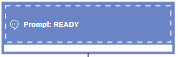 |
 |
| Resource | 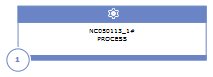 |
 |
| File | 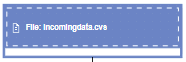 |
 |
| Internetwork dependency |  |
 |
| Dependency |  |
- |
| Conditional dependency | 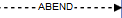 |
- |
| Join dependency | 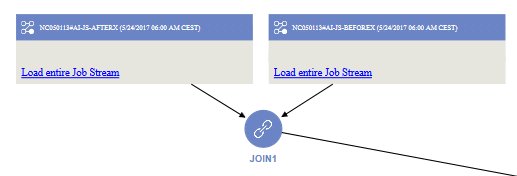 |
 |

| Status | Icon | Color |
|---|---|---|
| Blocked |  |
Red |
| Error |  |
|
| Running |  |
Blue |
| Successful |  |
Green |
| Canceled |  |
Grey |
| Suppressed |  |
|
| Held |  |
Light grey |
| Undecided |  |
|
| Waiting |  |
|
| Ready |  |
| Icon | Description |
|---|---|
 |
Remove the selected object from the view. Use it, for example, to remove a job from a job stream or a dependency from a job. The removal becomes effective only when you save the object. |
 |
Duplicate object. Available in the Workload Designer graphical view only. |
 |
Create a dependency. Click the icon, click an object, and then draw a line to the job stream or to the job that represents the depending object. The lines are drawn from the dependency to the depending object. |
 |
Remove all the dependencies of the object. Available in the Workload Designer graphical view only. |
 |
View the job log. Not available in the Workload Designer graphical view. |
 |
Rerun job. Not available in the Workload Designer graphical view. |
 |
View the properties. Not available in the Workload Designer graphical view. |
 |
Load successors. Not available in the Workload Designer graphical view. |
 |
Release dependency. Not available in the Workload Designer graphical view. |
 |
Open the actions menu which can also be accessed by right-clicking an object. Not available in the Workload Designer graphical view. |
Plan View
Use this view to get an overall picture of your plan.
This view shows a collapsed plan; it shows only the job streams, hiding any jobs and internal dependencies. External dependencies, both at job and job stream levels, are shown as arrows between job streams. If a job stream has multiple dependencies on another job stream, these are shown as one single arrow.
The following is an example of the view:
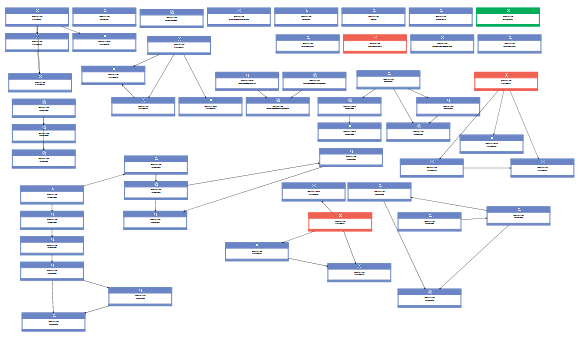
Because potentially a plan can contain a large number of job
streams, by default the Plan View displays a limited number of objects. You can determine which job
streams to display by specifying filtering criteria in the Show Plan View page before launching the view or from the
toolbar within the view itself. 
The maximum number of job streams
displayed by the Plan View is 1000. You can modify the default maximum number of job streams to
display in the Plan View by modifying the planViewMaxJobstreams property in the
TdwcGlobalSettings.xml global settings file for the Dynamic Workload Console.
- From the portfolio, click: .
- Specify any filter criteria and then click Go.
You can take multiple actions on the job streams in the
view by right-clicking them and choosing an option from the context menu such as the following:- Perform an action such as Cancel, Hold, Release, and add or remove a dependency.
- Launch and display a job stream in the What-if analysis Gantt chart.
- View the jobs in the job stream by launching the in context link to the Job Stream View.
Job Stream View
This view displays a picture of the job stream with all its jobs and related dependencies. You can navigate through the displayed jobs and job streams, choosing the level of predecessors and successors to display. By default, this view displays all the objects in the job stream and the first-level of external predecessors.
- From the table of results of a Monitor Jobs or Monitor Job Streams task, select an item and select Job Stream View from the toolbar.
- From the Plan View, right-click a job stream and select .
Use the Rename icon to change the name of the view. The Rename icon is displayed when you hover over the Job Stream View string.
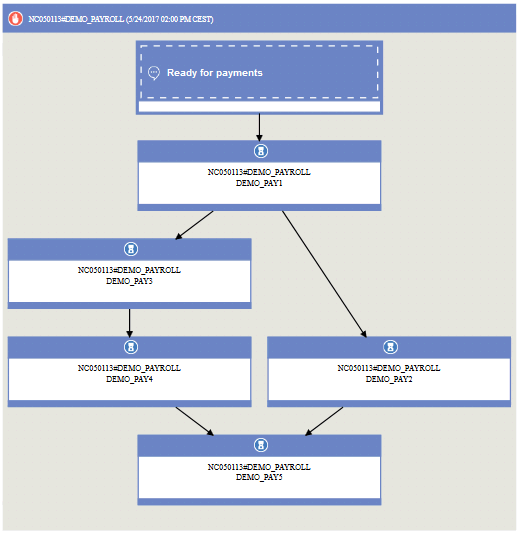
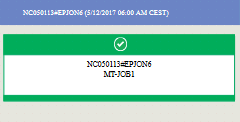
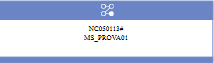
- JobsThe status of the job is indicated by the color and the small icon in the header. See Table 2 for the various icons representing the status. Additional information available about the job include:
- The deadline written in the lower-left of the rectangle representing the job.
- An icon is displayed in the lower-left indicating if the job is time dependent.
- The tooltip for the job indicates if the job is a critical job or a shadow job. Shadow jobs are jobs running locally that are used to map jobs running on the remote engine.
Further details are available in the tooltip displayed when you click on the job.
You can take multiple actions on the job by right-clicking it and choosing options from the context menu. The actions available depend on the selected engine and on the type of job. From this menu, you can view and print the job log and the job properties, or act on the job and its dependencies. You can also take actions on the job workstation or open the job and job stream definitions in the database to modify them.
- Dependencies
They are shown as boxes different from those used to represent jobs, connected to the depending objects by arrows that represent the dependency relationships. A joined conditional dependency instead is represented by the circle icon connected to the dependency arrows. To take actions on dependencies, you can right-click either the box or the arrow and choose an option from the context menu. Icons displayed in the box to the left describe the dependency type. Further details are available in the tooltip displayed when you click on the dependency. If dependencies within a job stream form a loop, this is highlighted in the view and a message appears, so that you can take the appropriate actions to resolve it.